Part I · What DIC measures
1. Two photographs and a question
Digital image correlation answers one question: how did the surface in this photograph move, compared with this other one? Everything else in this manual is about what that question does and does not let you ask.
The reference and the target
Every measurement starts with two photographs of the same surface: a reference, taken before whatever you are studying happens, and a target, taken after. A test with several load steps has several targets, each compared against the reference in turn - Part II covers what "compared" means once there is more than one.
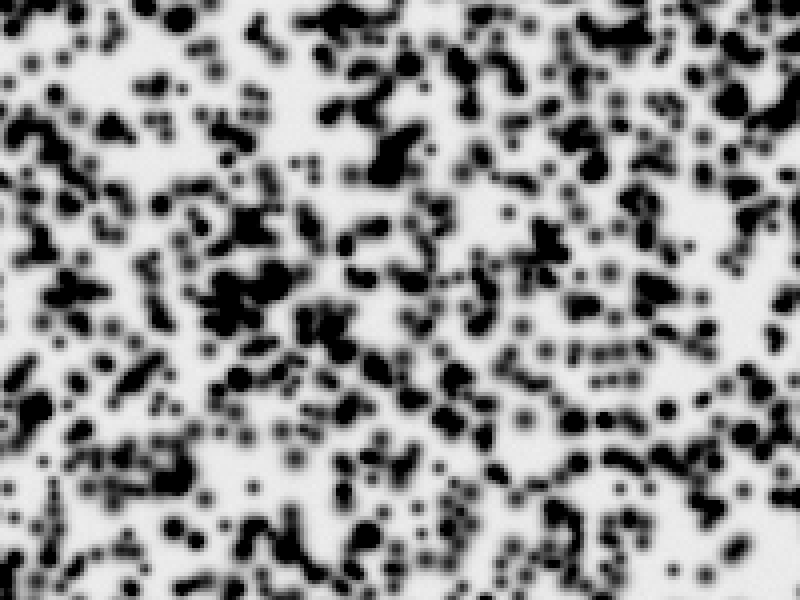
The surface has to carry a random, high-contrast texture: a speckle pattern. This is not decoration. It is what makes the measurement possible at all. A patch of featureless grey has nothing distinguishing it from the patch next to it, so there is no way to say which pixel in the target corresponds to which pixel in the reference - the correspondence is genuinely ambiguous, not merely hard to compute. A patch of speckle is different every few pixels in every direction, so its match in the target is (with enough contrast and enough texture) unique. Part V returns to what makes a pattern good.
The subset, and the grid
DIC does not try to match single pixels. It lays a grid of points over the reference image, and around each point takes a small square patch of pixels called a subset. For each subset, it searches the target image for the patch of pixels whose pattern of light and dark most closely matches it - allowing that patch to have moved, stretched, rotated, or sheared slightly, since the surface genuinely did those things between the two photographs. The centre of the best match is where that point of the surface now is. The distance between where it started and where it was found is the displacement at that point, in pixels.
Do this at every point of the grid and the result is a displacement field: not one number, but a value at every measured point, which can be drawn as a picture - usually a colour map, warm where the movement was large, cool where it was small.
How sure the match is
The search does not just report a best match; it reports how good that match was, as a correlation coefficient. A value close to its best possible score means the patch in the target looks almost identical to the patch in the reference, once the found deformation is accounted for. A poor score means no candidate patch looked convincingly like the original - the surface may have torn, gone out of focus, left the frame, or simply have too little texture in that subset to pin down at all.
This number is a statement about pattern-matching confidence, not a statement about physical truth. A subset can match with high confidence while telling you nothing you actually want to know - a smooth, empty patch of background can correlate excellently against itself while genuinely reporting no useful information. Confidence in the match and meaningfulness of the answer are related but not the same question, and Part III is built entirely around keeping them separate.
In one sentence
DIC follows small, uniquely textured patches of a photographed surface from a reference image to a target image, and reports how far each one moved and how confident it is in that answer.
Two-dimensional, stereo, and volumetric
"DIC" names a family of techniques rather than one, and they differ in what dimensions of movement they can see at all. The distinction matters before anything else in this manual, because it decides which questions a given measurement is even capable of answering.
Two-dimensional DIC: one camera, movement in the image plane
One camera looks squarely at a flat, or nearly flat, surface, and measures how that surface moves parallel to the image plane: two components of displacement, in-plane, at every point. This is what everything else in this manual describes, and what SurView measures today.
Its limitation is exactly its definition: it cannot see movement toward or away from the camera. Worse, it cannot tell such movement apart from real in-plane strain. A specimen that bows slightly out of plane appears, to a single camera, to have stretched - because the part of it that moved closer genuinely does image larger. That is not an implementation flaw to be fixed; it is information a single viewpoint does not contain. It is why a 2D measurement wants a specimen that stays flat, and why out-of-plane motion belongs on the list of things a noise floor cannot warn you about (Chapter 9).
Stereo DIC: two cameras, movement in three directions
Two calibrated cameras viewing the same speckled surface from different angles can triangulate each point, and so measure all three components of its displacement, out-of-plane included. This is universally called "3D DIC," and the name slightly overstates it: what it measures is a surface, one depth per point of the master camera's view, carrying a fully three-dimensional displacement. The geometry is two-and-a-half dimensional; the displacement on it is genuinely 3D. It cannot see inside the material, only the face turned toward the cameras.
Volumetric DVC: correlation through the inside of a solid
Digital volume correlation applies the same idea to a three-dimensional image of a specimen's interior, usually from X-ray computed tomography: instead of subsets of pixels on a surface, it follows subsets of voxels through the volume, and reports displacement and strain inside the material rather than on its skin. Natural texture in the material's own microstructure - porosity, inclusions, grain contrast - takes the place of an applied speckle pattern, since nothing can be painted onto an interior.
Which one this manual covers
Two-dimensional DIC only. That is what SurView measures today, and the rest of this manual is written for it throughout. Stereo and volumetric correlation are both real, tracked work on the roadmap - the correlation engine underneath SurView already carries much of what each needs - but neither has a workflow in the application yet, and a chapter describing a screen that does not exist would be worse than an honest gap. Read anything here about displacement, strain, or reliability as in-plane unless it says otherwise.
2. Displacement is measured, strain is fitted
Displacement and strain are reported side by side and look like the same kind of number. They are not measured the same way, and treating them as though they were is the single most common way to misread a DIC result.
Displacement exists at a point
A correlation finds where one subset went. That answer belongs entirely to that one point: ask "how far did this point move" and the field has a direct answer, measured by comparing that point's own neighbourhood in the reference against the target.
Strain does not
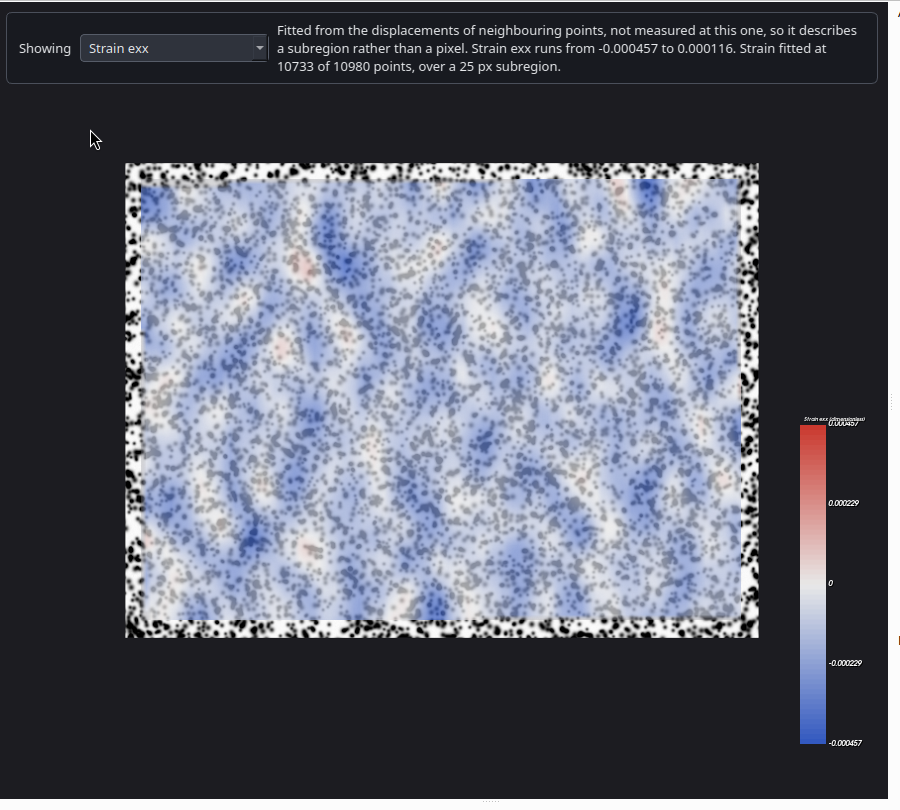
Strain is a measure of local stretching or shearing - how much a small patch of material deformed relative to its own neighbours, not how far it travelled. That is a gradient of displacement, and a gradient has no meaning at a single point on its own: it is a comparison between a point and the points around it. So strain is not measured directly at all. It is fitted: a plane (or a more general surface) is fitted through the displacements of every measured point inside a small neighbourhood, and the slope of that fit is the strain reported at the centre.
This has real consequences, and each of them is easy to miss unless a tool goes out of its way to surface it.
A declined fit is not a strain of zero
A fit can fail to find enough well-correlated neighbours to fit through at all. When that happens, the honest answer is "not established here", and a tool that quietly reports zero in that case is lying in the most dangerous possible direction: zero looks like a real, specific, reassuring answer - "this region did not strain" - rather than "this region was never evaluated". SurView carries the distinction explicitly, as a flag alongside every strain value, and a strain map with holes in it means exactly what it looks like: places nothing was established, not places nothing happened.
Neighbourhoods can be silently substituted
A fit needs a minimum number of neighbouring points inside its subregion. If a subregion does not contain enough of them - near an edge of the measured area, or near a hole, or wherever the displacement field itself is sparse - some engines will quietly reach further out and borrow the nearest points available instead of refusing, and the result looks exactly as complete as a properly supported fit. The honest response is to say, live, how many points a given subregion setting will actually gather before a run is even started, so a setting that would trigger this silently is visible before it is used rather than discovered afterwards.
Only well-correlated points get to vote
A point that correlated poorly is not trustworthy evidence about its own displacement, and a strain fit that used it anyway would be building a gradient on top of noise. DIC engines typically exclude points below a correlation threshold (0.9 is a common default) from every fit they could otherwise contribute to. A consequence worth expecting rather than being alarmed by: a strain map is often visibly sparser than the displacement map sitting right next to it. That is the fit being conservative, not a fault.
The trap that is easiest to fall into: extrapolation dressed as measurement
Here is the one worth reading twice. A strain fit is centred on a point and built from that point's neighbours. Nothing stops the fit from succeeding at a centre point whose own displacement was rejected: the centre simply excludes itself from its own regression and still receives a strain value extrapolated entirely from points around it. That value describes a place the instrument never actually got a reading from, and on the screen it is completely indistinguishable from a value measured where the instrument really did succeed.
This was found, not anticipated: a run reported "strain fitted at 1092 of the 1025 solved points" - more strain values than there were successful displacement measurements to fit them from, which is only possible if some of those strain values were sitting on points the instrument had already given up on. The fix is a rule that is nowhere in the correlation engine itself and has to be added on top: strain is reported only at a point whose own displacement was measured. A rejected centre gets no strain value, however good its neighbours look, because a value there would be an extrapolation wearing the same colour as a measurement.
What to check, every time
Before reading a strain map as an answer, check: are unmeasured regions shown as gaps, or could they be reading as zero? Does the strain map extend anywhere the displacement map itself has holes? If a tool cannot answer either question, treat every value near a boundary or a hole with real suspicion.
Two display choices that follow from this
Because strain and displacement are different kinds of quantity, they should not share a colour convention. A strain field's scale is centred on zero, because zero strain is a real physical state (nothing stretched) and the sign either side of it is meaningful (tension against compression). A displacement field's scale is not centred, because a displacement of zero is only "wherever the reference frame happens to sit" - a specimen that simply translated across the frame would spend half its colour range on values that cannot occur if the scale were forced to straddle zero.
3. A rejected point is not a zero
One principle, showing up in every part of a DIC result: a place the instrument did not measure, and a place the instrument measured a value of zero, must never look the same. This chapter states the principle once so the rest of the manual does not have to keep re-arguing it.
Why zero is the dangerous default
Software defaults numeric fields to zero constantly, and it is usually harmless. In a measurement field it is not, because zero is never a neutral placeholder here - it is always also a legitimate, meaningful answer. Zero displacement means "this point did not move." Zero strain means "this material did not deform." A rejected point defaulting to zero is therefore not a blank; it is a false and entirely plausible-looking claim, and it looks exactly as confident as a real one.
The fix is the same everywhere it applies: use a value that cannot be mistaken for a measurement - not-a-number, a missing entry, a hole in a colour map - and carry a separate flag saying whether a value was actually established. "Nothing here" and "zero here" have to stay two different, unconfusable states, all the way from the engine to the screen to whatever file the result is exported into.
Where this shows up
- A rejected point's displacement. The correlation failed, or the subset moved out of frame, or the match was too poor to trust. The point is marked as not converged, and reports no displacement value at all - not a displacement of zero.
- A declined strain fit (Chapter 2): the same rule, one derived quantity further out.
- An unestablished reliability figure (Part III): a noise floor or match-conditioning value that could not be computed is absent, never zero - zero would be the single most flattering, and therefore most misleading, reading either metric could give.
- A frame a sequence could not read (Part IV): missing from a curve as a visible break, never plotted as though the quantity had returned to zero.
- An exported field (Chapter 13): the same absence has to survive leaving the application. A viewer that assumes every cell holds a number, and a format that cannot represent "not established", quietly turn every one of the cases above back into a lie the moment the file is opened somewhere else.
A reading habit worth having
When a field looks unusually smooth or unusually complete, ask what would have happened to a point the instrument could not measure. If the honest answer is "it would look identical to a real zero," the field is not to be trusted at face value, whichever tool produced it.
4. One coordinate frame
Every number in a DIC result is a position or a displacement, and every position or displacement is meaningless without knowing which way the axes point. This is duller than the rest of Part I and just as capable of quietly ruining a result.
Image coordinates, not maths coordinates
A photograph is stored as rows of pixels, and the row order is a convention, not a law: some formats store the top row of the image first, others store the bottom row first. Screen and image coordinate systems follow the file: x increases to the right, and y increases downward, with the origin at the top-left pixel. That is the opposite of the y-axis convention used in ordinary graphing, where y increases upward - and a rendering system built for graphs (as most 3D and plotting toolkits are) will get this backwards unless it is deliberately told not to.
Why this has to be nailed down explicitly, once
Different image formats do not even agree with each other. Some readers honour a file's own stated orientation; others always deliver rows in one fixed order regardless of what the file says. Left alone, this produces a genuinely alarming failure mode: some image formats display correctly and others display vertically mirrored, silently, depending only on which file format happened to be used for that particular photograph - with nothing about the mirrored image looking obviously wrong at a glance, since a flipped photograph of a speckle pattern still looks like a perfectly plausible speckle pattern.
The only reliable fix is to normalise every image, on the way in, to one stated row order, and to make every other coordinate in the system (a click on screen, a region's corners, a measured point, a rendered field) agree with that same order and with nothing else. Once that is true, a click on the picture, a point in the result, and a pixel in the exported file are all talking about the same place without any conversion between them anywhere in the pipeline - which is also what makes it safe to overlay a result directly on top of its own reference photograph and trust that they line up.
Why an exported file has to say so explicitly
A result rarely stays inside the tool that produced it. It gets opened in a general-purpose viewer that has its own, entirely reasonable, default assumption about which way is up - usually the graphing convention, not the image convention. If the file does not state its own coordinate frame, a viewer that assumes the wrong one draws the field mirrored, and there is no way to tell from looking, because a mirrored field of a real specimen still looks like a plausible field of some specimen. The one thing that catches it is laying the exported field directly back over the original photograph: a field that lines up is right, and a field that lines up perfectly except flipped is a coordinate-frame bug wearing the appearance of a correct result.