Part IV · Beyond one field
12. Reading a sequence as a curve
One field is a snapshot. What a loading test is actually for is a curve - strain against load step, elongation against time - and getting from a stack of fields to a trustworthy curve has its own ways of going wrong.
The virtual extensometer
A physical extensometer is a clip gauge: two arms attached to a specimen a fixed distance apart, reporting how that distance changes as the specimen deforms. A virtual extensometer is the same idea done in software: place two points anywhere on the measured field, and read the change in the distance between them across every frame of the sequence.
It measures the gap between the anchors, never the movement of either one
This is the rule that matters most, and it is easy to get backwards without noticing, because a common way to test the idea does not expose the mistake. A gauge has to compute the change in distance between its two anchor points, not the displacement of either anchor on its own. A specimen carried bodily across the frame - a pure rigid translation, no stretching at all - has genuinely strained by nothing whatsoever. An implementation that (by mistake) read one anchor's own displacement instead of the gap between the two would turn that rigid motion into a large, smooth-looking, entirely fictitious strain reading.
The trap in verifying this: testing only with a pure stretch centred on the origin will not catch the bug, because under that specific kind of deformation the two calculations happen to agree by coincidence. It takes a genuinely rigid translation, tested on its own, to tell the two apart.
An anchor needs real measurement on all sides to mean anything
An anchor placed between grid points does not sit exactly on a measured point; its reading is interpolated from the four points around it. If any one of those four is a gap (Chapter 3), every obvious way to paper over it is dishonest in its own way: using the three that remain quietly changes what is being averaged; reaching further out for a substitute borrows a reading from somewhere the anchor is not; filling the gap with zero drags the whole reading toward "did not move," which is the most plausible-looking wrong answer available. The honest response is to refuse the reading outright and let the anchor be moved somewhere the field can actually support it.
A gap in the curve is drawn as a gap
Some frames will not be readable - an anchor sat over a hole (Chapter 5), or that frame's field simply did not measure enough of the specimen. Dropping that frame from the curve and drawing a straight line from the frame before it to the frame after would fill territory nobody actually measured with a segment that is, on the screen, indistinguishable from real data. The honest curve breaks visibly where a frame could not be read, and says so in words, rather than smoothing over the hole.
Verified, not merely argued
A synthetic tension sequence ships with an exactly known answer for every frame, and a virtual extensometer placed on it reads 0.005, 0.010, 0.020 and 0.036 against stated strains of 0.005, 0.010, 0.020 and 0.035 across four frames - close enough, over displacements reaching tens of pixels, to trust the method rather than merely the argument for it.
A profile along a line
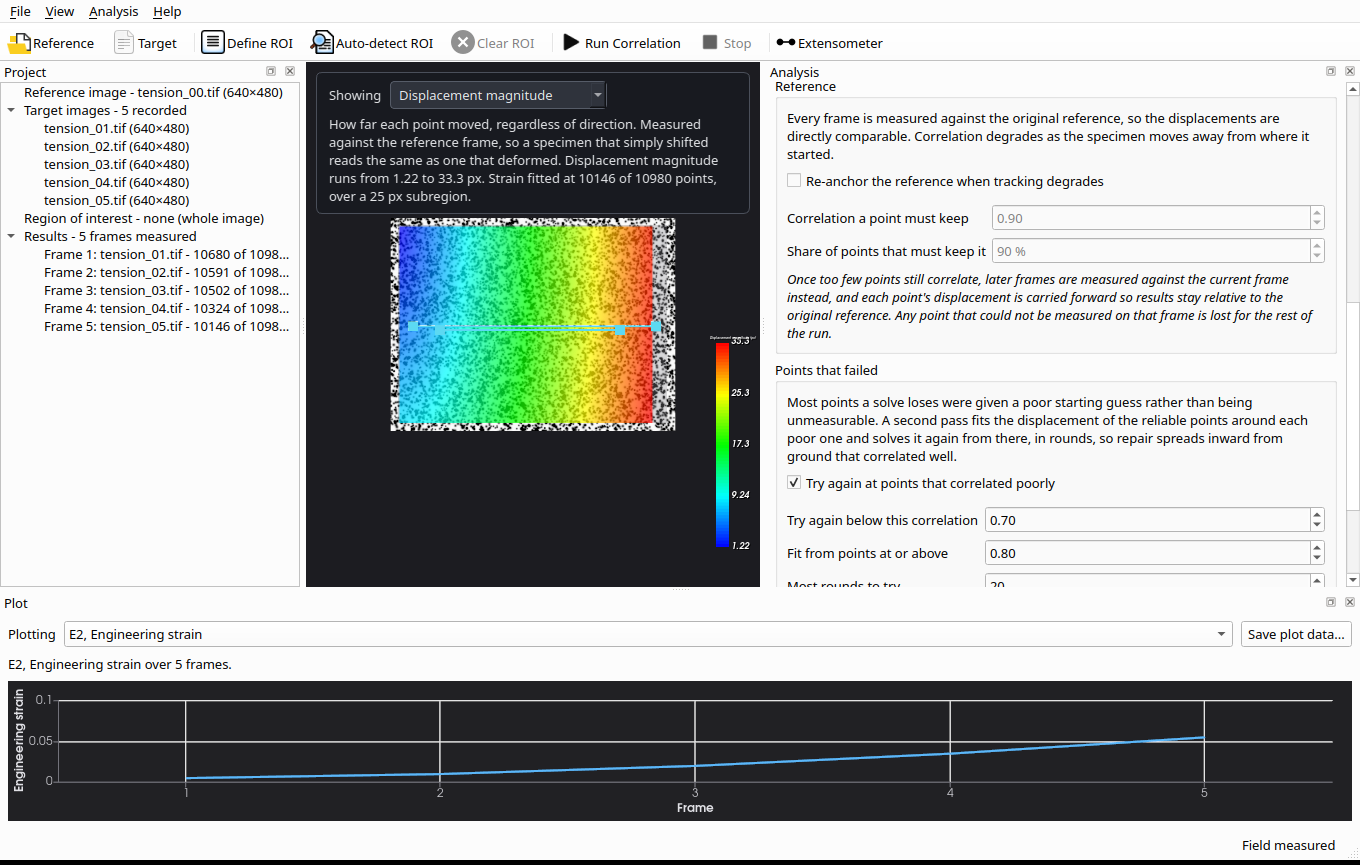
The extensometer reads one place across every frame. The line probe reads the other way: one frame, along a line. Two clicks draw it, and the Plot panel shows whichever map is on screen along it, for the frame on screen - switch the map or the frame and the profile follows. The line carries a tick at every sample, one per grid step or closer, because that is how densely the field was measured: each sample is interpolated from the four grid points around it, and where any of those four was not measured the profile has a gap, not a value. A map with two states, such as the second-pass map, has nothing between its states to read, and the panel says so.
13. The field leaving the application
A result rarely stays where it was produced. It gets opened in another tool entirely - a general-purpose scientific viewer, a spreadsheet, a finite-element package - and every principle this manual has argued for has to survive that trip, or it was never really upheld at all.
Geometry says where the instrument looked; the data says what it found
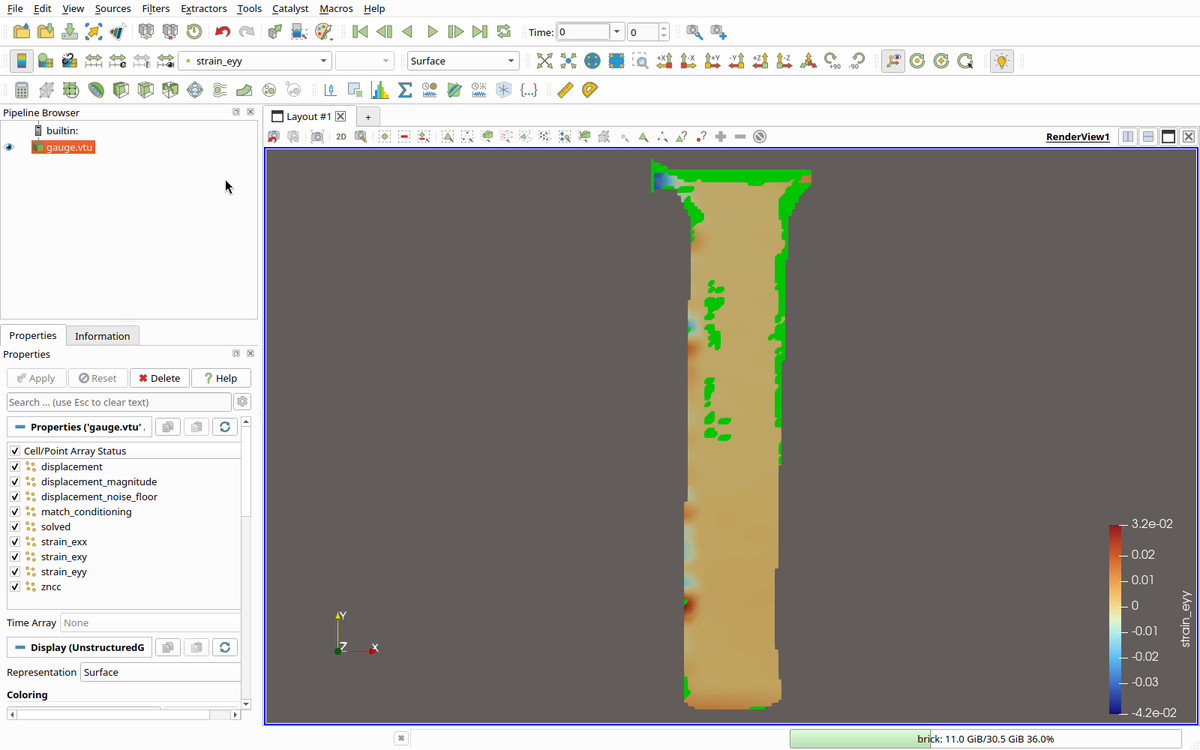
An exported field's underlying mesh should cover every place a measurement was attempted, not merely every place it succeeded. If the geometry itself shrank to fit only the successful points, a difficult specimen would quietly export as a smaller, easier-looking one than it really is - the very difficulty that makes it worth studying would disappear from the file before anyone else ever saw it. The data arrays sitting on that geometry are where "attempted but not measured" actually gets stated, following the same absence-not-zero rule as everything else.
The same "not zero" rule, one file format further out
In almost any viewer, a field of zeros renders as a perfectly reasonable, uniform blue region - entirely indistinguishable from a genuine measurement of no movement. An export has to carry unmeasured values as not-a-number, exactly as the application's own screen does, and state outright, in an array of its own, which points were actually measured - rather than leaving a reader to infer it from wherever the holes happen to be. A derived quantity that was never asked for at all (strain, on a run where it was switched off) should be absent from the file entirely, not present and filled with not-a-number everywhere: an array that is entirely not-a-number reads as "we tried and failed everywhere," which is a much more alarming and much less accurate claim than "this was never attempted."
A file has to state its own coordinate frame
Chapter 4 explained why one consistent coordinate frame matters inside the application. The moment a field leaves it, that guarantee is gone: whatever opens the file next has its own default assumption about which way is up, and there is no reason to expect it matches. The file has to say, explicitly, which convention its coordinates use, so a reader - human or software - does not have to guess and does not draw the field mirrored without any way to notice.
Provenance travels with the file, captured at the moment that matters
A trustworthy result carries an account of how it was made: both source images identified precisely enough that a substitution would be caught, the settings the correlation actually ran with, the region that was used, and the exact version of the software and its engine that produced it. That account has to be captured when the run starts, not read back from an on-screen panel afterward - a panel that keeps accepting input after a run finishes will, if read late, describe a configuration that never actually produced anything, attached with complete confidence to a result that was really made under different settings entirely.
A trap worth knowing about, generally
A file-writing call that reports success is not automatically proof a file was written. It is worth checking, once, that the specific writer a pipeline depends on actually fails loudly - some report success even when the destination directory does not exist and nothing was written at all. A confirmed write, not merely an unrejected one, is the only thing that should tell a user their result is saved.
14. A reference and a target from separate sessions
Not every target is photographed by a camera that stayed where it was. A specimen is taken off the machine and photographed again a week later; the camera is moved, refocused or replaced; a strip is recovered from a structure and photographed on a bench. The target then sees the scene larger or smaller, turned and shifted, and often in an image of a different size. SurView measures such a pair, and says plainly what the move between the sessions costs.
The camera move is taken out of the coordinates, never out of the pixels
Turn on Reference and target from separate sessions, first in the Reference section of the Analysis panel. Each target is then aligned to the reference before it is measured: features are matched between the two images, the camera move is fitted to them as a similarity (a scale, a turn and a shift), and the fit is refined by correlating subsets, to a few thousandths of a pixel.
The move is then applied to coordinates. Every point starts from it, is measured on the target exactly as the target was recorded, and has its answer carried back into the reference's pixels. No image is warped to match the other at any step. Warping one would put an interpolation into the record before anything had been measured, and the record is what everything else stands on. The run report and both exported files say which frame the answers are in: positions and displacements are in the reference image's pixels, with the camera move taken out.
Each target is measured against the reference on its own. A point followed from one target to the next would sit in that target's camera, which no alignment describes, so with the switch on the reference is never re-anchored (Chapter 7), and the panel greys that control and says why beside it.
What the move is fitted on decides what can be measured
A similarity is a scale, a turn and a shift. A specimen's own rigid motion is a turn and a shift, and its uniform dilatation, the part of the strain that is the same in every direction, looks to a camera exactly like a zoom. Fitted on the specimen itself, the alignment cannot tell the two apart, and takes all of it for the camera. The strain lost is a real strain, and every point still correlates well, so nothing in the field gives the loss away.
Measured on a pair made for the purpose, with the specimen strained by 0.012 in x and -0.005 in y and the camera moved by a scale of 1.07, a turn of 3.5 degrees and a shift: with the move fitted on stationary ground, every strain term comes back within 3e-4 of the truth. Fitted on the specimen, both normal strains come back short by the same 0.004, which is the dilatation, gone from both in equal measure.
Ground: mark what did not move
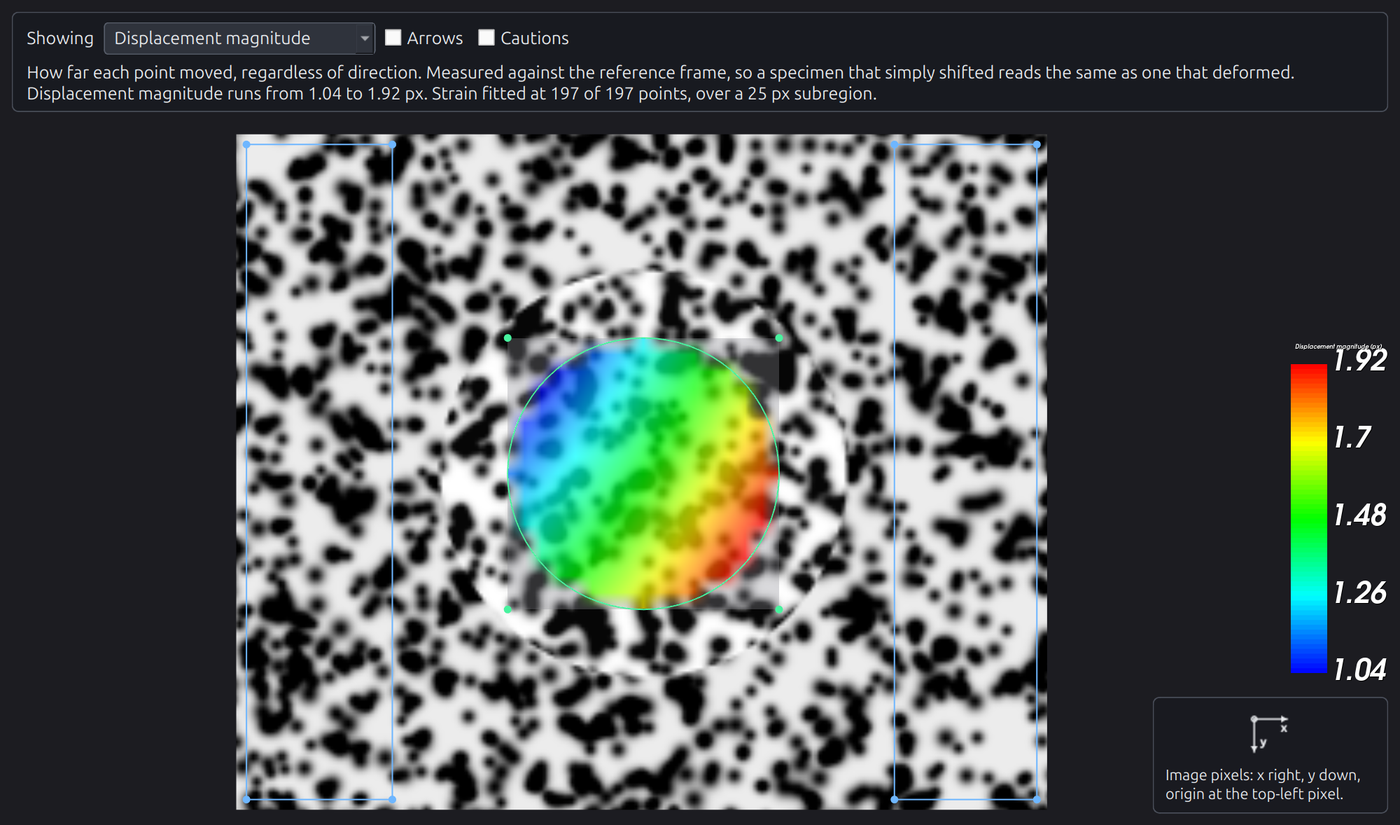
Mark Ground on the toolbar draws a rectangle, an ellipse or a polygon over something that did not move between the sessions: the bench, a fixture, the frame of the machine. Ground is drawn in blue. It is not measured, it is not part of the region's order (Chapter 5), it stays where it was drawn when the region is dragged, and auto-detection keeps it. It needs no region at all: with ground alone, the whole image is measured and the target is aligned on the ground. Fitted on ground, the specimen's own movement is measured in full, its rigid motion included.
The tool is live only with the switch on, and while it is not, it says which switch would make it so. Ground marked with the switch off stays on the reference and is listed in the project as not used.
The fit is refined on subsets lying wholly on the ground, each the run's own subset size, so ground must be wider than one subset, and needs room for at least six of them. The project tree counts them as the ground is drawn and warns when there are too few ("Ground fits 0 of 6 subsets needed"), following the subset radius as it changes.
Ground drawn over the region measured is warned of in the tree too, in pixels ("Ground inside region"), since it is then taken as stationary and measured as moving at once; that is right only for a stretch of bench measured on purpose. After a run, the report names every ground subset the fit set aside as not following the camera move, how far from the fit each was found against the subsets it kept, and where the farthest one is. Set aside 1.5 px from a fit good to 0.002 px, ground moved; it is not ground, and should be taken out of what is marked. The fit's setting aside is a safeguard, not a substitute for keeping ground clear of everything that moves.
No ground: a known length gives the scale
Sometimes there is nothing stationary in the picture at all; a strip photographed on its own is the usual case. What is lost then is one number, the camera's scale, and a known length restores it: two points whose distance did not change between the sessions, such as the ends of a scale bar, two fiducials, or two marks on a part that does not deform. Mark Known Length, in the Mark Ground menu, places it with two clicks on the reference.
Each end is found on the target by correlation, and the camera's scale is taken from the ratio of the two lengths. Only the turn and the shift are then fitted on the specimen, so its rigid motion is still taken for the camera, and all of its strain is measured, the dilatation included. On the same pair as above, every strain term comes back within 3e-4 again.
- Its ends must be on something that did not deform. Its length is taken as unchanged, so an end on the specimen hands the specimen's stretch along it to the camera's zoom; the tree warns of an end inside the region measured.
- Its ends must be found. Each needs distinct marks or pattern visible in both sessions, a subset radius clear of the edge of both images. An end that does not correlate refuses the run, naming the end, rather than measuring as though no length had been marked.
- A longer length is a better one. An error in finding an end changes the measured dilatation by that error divided by the length, and the run report states what 0.01 px at either end does: over 250 px, 4e-5.
- Ground comes first. Ground measures the scale itself, from far more of the picture than two points, so with ground marked the known length is listed and reported as not used.
With neither, the result says what it could not measure
A run with no ground and no known length still aligns, on the region measured or failing that on the whole image, and the switch's note, the run report and both exported files say what that cost: the specimen's rigid motion and its uniform dilatation are not measured. Strain differences between directions, and shear, are measured either way.
A camera that also tilted
A camera set up again by hand is rarely square to the specimen in the same way twice. Tilted, it sees one side of the scene a little larger than the other, which a scale, a turn and a shift cannot describe: on a test pair whose scale runs 5 per cent across the picture, the similarity is wrong by several pixels at the edges.
Every run aligned on ground also fits a perspective move through the same ground, as a check, and the report says how far it departs from the similarity over the region measured: under a thousandth of a pixel on a camera that did not tilt, about 7 px on the test pair. Where that is not small beside the movement being measured, turn on Camera tilted between the sessions (perspective), beneath the sessions switch. The move is then fitted as a homography, and the report gives its scale as a range across the region measured, with the homography itself.
- On ground only. A perspective move fitted on the specimen would take up every uniform strain, not only the dilatation, so a run asking for it with no ground marked is refused, and the switch's note says so before the run.
- With second-order subsets. Under a tilt the camera's own warp curves across each subset, which a first-order subset cannot follow: on the test pair, first-order subsets measured the specimen 0.024 px off on average where second-order ones measured 0.005 px. The report says so when a tilted run used first order.
- The plane, not what stands off it. A homography maps one plane exactly. The ground and the specimen surface should lie in about the same plane, as a specimen on its bench does.