Part III · How much to trust it
9. Two questions, never one score
"How reliable is this measurement" sounds like one question. It is genuinely two, they have different answers, and collapsing them into a single quality score throws away exactly the information that would let you tell which kind of problem you are looking at.
Question one: how well could this ever have gone?
A speckle pattern has more or less texture, more or less contrast, in any given small patch. Some patches are naturally easier to lock onto than others, independent of anything that happens to them afterward - a patch with strong, varied local contrast can be located far more precisely than a smoother, weaker one, purely as a matter of how much information is in the pattern itself.
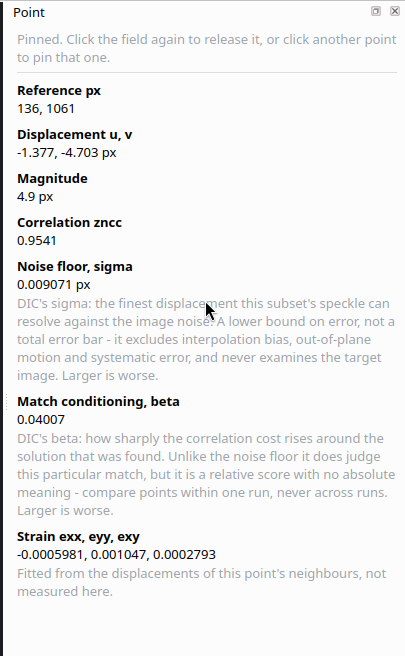
A noise floor answers exactly this: given the pattern's own local contrast and the camera sensor's own noise level, what is the finest displacement this particular subset could ever resolve? It is computed from the reference image alone, comparing the subset's gradient strength against an estimate of the sensor's noise.
What it cannot see
Because it never looks at the target image at all, a noise floor cannot see anything that goes wrong during the measurement: decorrelation, out-of-plane motion, focus drift, or a shape function too poor to represent the real deformation. It is a lower bound on how good a result could be, never a total error bar on how good the result actually was.
In practice it behaves like a map of speckle quality, expressed directly in the units that matter: pixels of displacement. On real measured data it typically sits in the range of a few thousandths of a pixel - small enough that reading the bare number in isolation is nearly meaningless. Chapter 10 covers how to read it usefully.
Question two: how confident is this particular answer?
Match conditioning asks a different question: around the specific solution this search actually converged to, how sharply does the matching cost rise as the candidate position moves away from it? A sharp, well-defined minimum means the search landed somewhere unambiguous. A shallow, flat-bottomed minimum means many nearby positions matched almost as well, so the reported position, while a genuine best answer, carries more uncertainty about exactly where the true match sits.
Unlike the noise floor, this probes the actual match that was found, so it does respond to problems during the measurement. It is dimensionless and has no absolute scale of its own: it is only meaningful within one run, comparing one point against another in the same field, never across two different runs or two different specimens.
And before either: did the camera record anything there?
Where the sensor ran out of range - glare off a shiny or wet surface, a shadow crushed to black - every pixel holds the same value and the speckle in it is gone. A subset made mostly of such pixels has nothing to correlate, and it can still converge: flat matches flat, with a high correlation and a displacement that means nothing in particular. The clipped share of subset states, for every point, how much of its reference subset sits at the darkest or brightest value the image actually holds. A few per cent is ordinary; more than half is a warning, said in the point readout and counted in the run report. Drawing a region keeps glare off the background out of the measurement; glare on the specimen itself it cannot, and this is what shows where it is.
Every caution at once, over the map you are reading
Each of these cautions is stated where it belongs - in the point readout, in the run report, on a map of its own - and none of them is visible on the displacement or strain map a reader is actually deciding from. The Cautions switch beside Arrows marks every measured point that carries one, on whichever map is showing: × more than half the subset clipped, ○ moved less than its own noise floor, △ correlation below 0.9, □ a match too flat to probe. Beside the marks it counts them, over the whole field or, once zoomed in, over what is in view, and says which.
It is deliberately a count, not a confidence. Nothing here converts to a probability that a point is right, and a percentage labelled confidence would claim a calibration the instrument does not have. "154 of 160 measured points carry no caution; 6 do, 5 of them mostly clipped" says exactly what is known and where to look. Cautioned points are not removed: they stay in the field, marked.
Both read the opposite way from everything else
Every other quantity in a DIC result - displacement, strain - is read the ordinary way: a value simply is what it is, neither good nor bad on its own. Both reliability figures are different: for both of them, a larger number is worse, the way a margin of error is worse the larger it gets. Reading them with the wrong habit - treating a large value as an interesting hotspot rather than a warning - is an easy mistake to carry over from every other channel, and it needs to be stated plainly wherever these numbers appear, not left to be inferred.
Zero is the most dangerous value either can show
Neither figure can honestly reach zero. A zero noise floor would claim a perfectly resolvable measurement; a zero match conditioning would claim a perfectly sharp, unambiguous cost minimum. Neither is physically reachable. So a value that is not strictly positive was never actually established - it is the same "absence, not zero" principle from Chapter 3, and it applies with particular force here, because zero looks like the best possible reading a reader could hope for, rather than an obviously suspicious one.
A bare number needs something to be measured against
A noise floor of a few thousandths of a pixel means nothing on its own - whether that is excellent or barely adequate depends entirely on how large the displacements being measured actually are. Putting it against the largest displacement the run actually measured turns it into a sentence that means something on its own: something like "at worst, one part in several hundred of the largest movement measured." That comparison uses only numbers the run already produced; it invents no external idea of what counts as a "good" noise floor, which would only be a threshold pulled from nowhere in particular.
10. Reading a field critically
A colour map is persuasive by nature - smooth gradients look authoritative whether or not they deserve to. This chapter is a checklist for looking at any DIC field, from any tool, without being talked into more confidence than the data actually earns.
Read the scale before reading the colours
What is the range, and what are the units? A field that runs from 3.000000 to 3.000002 pixels is, for all practical purposes, uniform - and drawn with the same rainbow as a field that genuinely spans a wide range, it can look just as dramatic. The colours alone cannot distinguish real variation from noise sitting at the sixth decimal place; only the number on the scale can.
Is zero centred, or is it not?
A strain scale should be centred on zero, because zero strain is a real physical state and the sign either side of it means something (tension against compression). A displacement scale should not be, because a specimen that merely translated across the frame has no reason for its displacement to straddle zero at all. If a scale's centring does not match which kind of quantity is on screen, treat every colour on it with suspicion until that is understood.
Which direction is "worse"?
For an ordinary measurement, a large value is just a large value. For a reliability channel (Chapter 9), a large value is a warning. The same warm-to-cool colour ramp can be used for both, and nothing about the colours themselves tells you which reading applies - only the label does. Check what is actually being shown before deciding whether the red patch is the interesting result or the part to distrust.
Are the holes really holes?
Ask what an unmeasured point would look like on this particular map. If the honest answer is "identical to a genuine zero," as Chapter 3 warns, then a smooth-looking field may be smooth because the tool filled in the gaps with the most reassuring possible value rather than because the specimen actually behaved smoothly. A field that is willing to show visible holes is, perhaps counterintuitively, more trustworthy in the parts that remain than one that never does.
Does the field extend further than the measurement that feeds it?
A strain map should never reach further than the displacement map it was fitted from (Chapter 2), and a repaired point (Chapter 8) should be visibly marked as one if that information is available at all. A field that looks suspiciously complete, with no trace of where the underlying measurement actually struggled, is a field worth asking harder questions about.
The five-question pass
Scale and units. Centred on zero, or not. Which direction is worse. Are the gaps real. Does this field outrun what it was built from. Running through these five before reading any conclusion off a DIC field takes seconds, and it is where most confident misreadings actually get caught.
11. Checking against a known answer
Every other chapter of this part is about reading a measurement whose true answer nobody knows. On the synthetic examples that ship with SurView, the true answer IS known - exactly, not approximately - and the application will put it on screen beside what it measured, with the difference between the two as a third map.
Why the answer is exact, and why that matters
The synthetic sets are not photographs that were warped. Each frame is rendered from a list of Gaussian blobs under a uniform deformation gradient, and a uniform deformation maps a Gaussian to another Gaussian exactly - so every frame is drawn afresh from the pattern at its own deformation, and no pixel is ever resampled. The displacement stated beside the images is therefore the truth, not a very good estimate of it. Sensor noise is added afterwards, and pixels are integrated by supersampling, which is what a real sensor does.
That is what makes the third panel an error map rather than a disagreement between two estimates. Against a real specimen the same three panels could not be drawn at all: nothing states what the specimen did.
What the three panels show
- Measured - the field SurView produced, exactly as the main viewport draws it, blank wherever the run measured nothing.
- Stated by the example - the same quantity from the stated deformation, at every point the run attempted, including the ones it could not measure. The two panels therefore differ in shape wherever the measurement has holes, which is the point: it shows what was missed as well as what was got wrong.
- Measured minus stated - the difference, only where something was measured. A point the solver rejected has no error of zero: an error of zero is the answer being right, and painting it over the points the instrument could not read would claim it did best exactly where it did nothing.
The first two panels share one colour scale, and the third is centred on zero. The shared scale is what makes the comparison mean anything: ranged separately, a field wrong by half would be painted in exactly the colours of the answer it missed.
Strain is compared in the measure you chose
The two strain measures genuinely disagree about the same deformation. A rigid rotation of three degrees is exactly zero strain in the Green-Lagrange form, and about -0.0014 in the linear one - the linear form's own well-known error on large rotations (Chapter 2), not a fault in the measurement. So the stated answer is evaluated in whichever measure the run used. Comparing a Cauchy run against a Green-Lagrange truth would show that difference of convention as an error of the instrument.
This is also the most direct way to see the trade for yourself: run the rotation example both ways and watch which measure the difference panel prefers.
What the difference panel is not
It is the error against one particular known deformation on one particular synthetic pattern, at the settings currently in the Analysis panel. It says what this configuration does on this data. It is not a general accuracy figure for SurView, and it is not an error bar you can carry over to a real specimen - a real speckle, a real camera and a real load path all fail in ways a rendered pattern cannot.